Siblings, fake siblings and neighbourhood effects?

Recently completed work by Prof David Manley and colleagues at TU Delft and Uppsala University has been published in PLOS ONE and Annals of the Association of American Geographers. The work used the Swedish Population Register data, held at the University of Uppsala to explore the intergenerational transmission of neighbourhood characteristics on later neighbourhoods career and their later life income trajectories.

Understanding how inequalities are transmitted through generations and restrict upward spatial mobility is increasing receiving attention in the literature and the idea that the neighbourhood in which someone grows up is highly predictive of the type of neighbourhood he or she will live in as an independent adult has gained traction. Drawing on the tradition of sibling studies we created to sets of siblings – one set of real siblings who shared both geography and household and a set of ‘contextual siblings’ or people who grew up in the same place – that is they share geography – but not the same household. Using these two groups what we set out to find out in these two papers was firstly, what is the relative contribution of geography compared to the contribution of the family context in forming these individual life outcomes. When then secondly used the sibling design to explore if we could disentangle family and neighbourhood effects on income. Ultimately, what the sibling design helps us to do is separate the effects of childhood family and neighbourhood context from adult neighbourhood experiences

The papers identify that siblings live more similar lives in terms of neighbourhood experiences during their independent residential careers than contextual sibling pairs but that this difference decreases over time. The results show the importance of geography, revealing long-lasting stickiness of spatial–temporal contexts of childhood. In terms of the effects these places then have we can see that the neighbourhood effect on income from both childhood and adult neighbourhood experiences, is biased upwards by the influence of the childhood family context. Ultimately, we conclude that there is a neighbourhood effect on income from adult neighbourhood experiences, but that the childhood neighbourhood effect is actually a childhood family context effect.

New MSc in Geographic Data Science and Spatial Analytics

We super happy to announce our new MSc in Geographic Data Science and Spatial Analytics which is starting in September 2021!

Are you passionate about using data and analytics to improve cities and solve spatial problems? The MSc in Geographic Data Science and Spatial Analytics will help you achieve your ambitions. You will learn how to utilise cutting edge tools and methods from data science to analyse spatial data in order to tackle challenges spanning across various spatial scales: from neighbourhoods and cities to regions and supra-national systems.

Whether your background is in Geography, Planning and, more broadly, Social Sciences or in numerate sciences such as Computer Science and Engineering this programme will help you succeed in the dynamic fields of Geographic Data Science and Spatial Analytics.

You will master data science and machine learning algorithms, tools, and data structures and apply them to understand the core theories and concepts in urban analytics and city science. You will be able to employ cartographic and geographic theory and concepts to map and model big geographic data. You will understand the main engineering concepts and principles around scientific computing and data infrastructure and use them to model smart cities and urban digital infrastructure.

The MSc in Geographic Data Science and Spatial Analytics builds upon the Quantitative Spatial Science (QuSS) research group within the School of Geographical Sciences and its longstanding history and excellence in quantitative geography and spatial analysis.

This programme will be covered in our Geography: Data Science and Environmental Modelling webinar during our virtual open weekRegister today.

COVID shows that better broadband is not enough to keep local economies afloat

By Hannah Budnitz and Emmanouil Tranos

When COVID saw the UK government tell people to work from home in early 2020, the expectation was that they would use digital technologies to do so. Scientists worldwide have since highlighted how the pandemic has intensified the effect of the digital divide (the gap between those who have access to the latest technology and those who do not).

Amid its COVID recovery plans for England, the UK government is aiming to expand digital infrastructure, 5G and fibre optic broadband across the country.

As our research shows, however, bridging the digital divide is about more than making sure everyone has access to digital infrastructure and having the skills to use it. Communication scientists speak of the third level of the digital divide: the capacity to use digital technologies to enhance economic activities.

Patterns of demand

Household demand for bandwidth to download large video files or stream faster from online television services has been growing for a long time. Conversely, until the pandemic hit, relatively few people were using data at a volume that would have affected network performance.

When half the workforce started working from home, however, and the country’s schoolchildren and students were sent home too, videoconferencing took off. We expected this extreme demand for telecommuting during working hours to change the pattern of internet use and broadband performance.

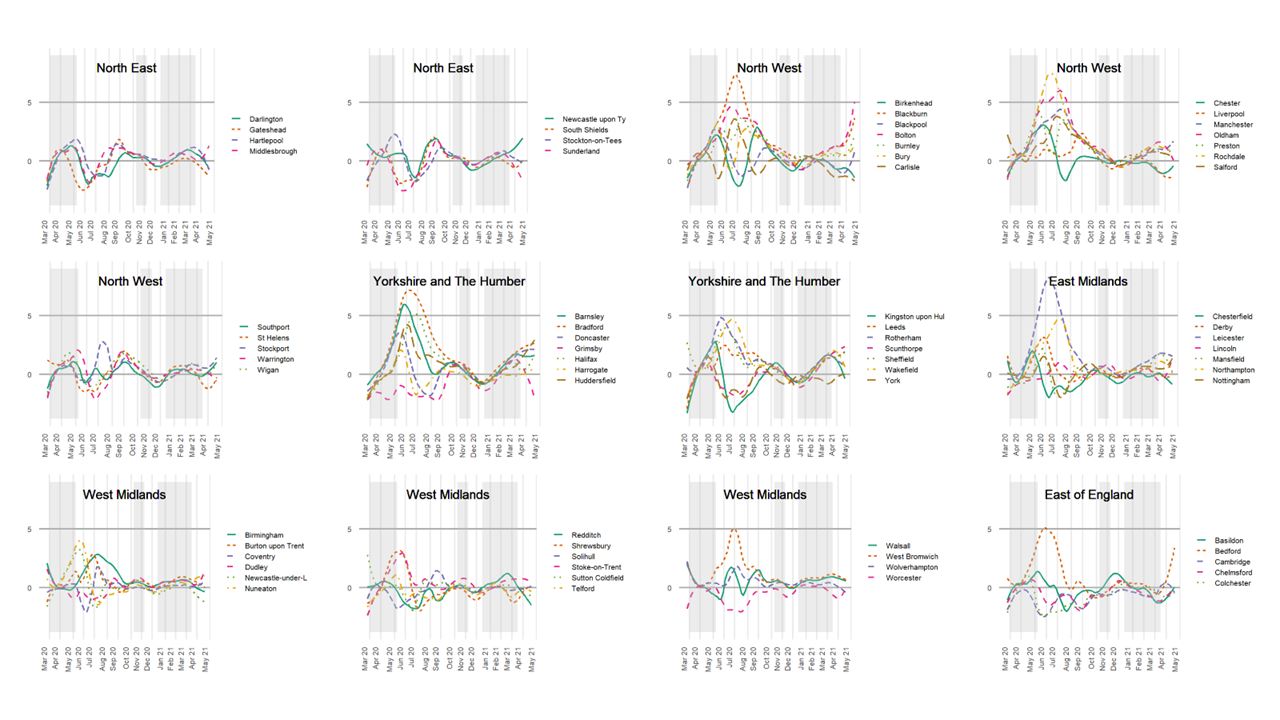
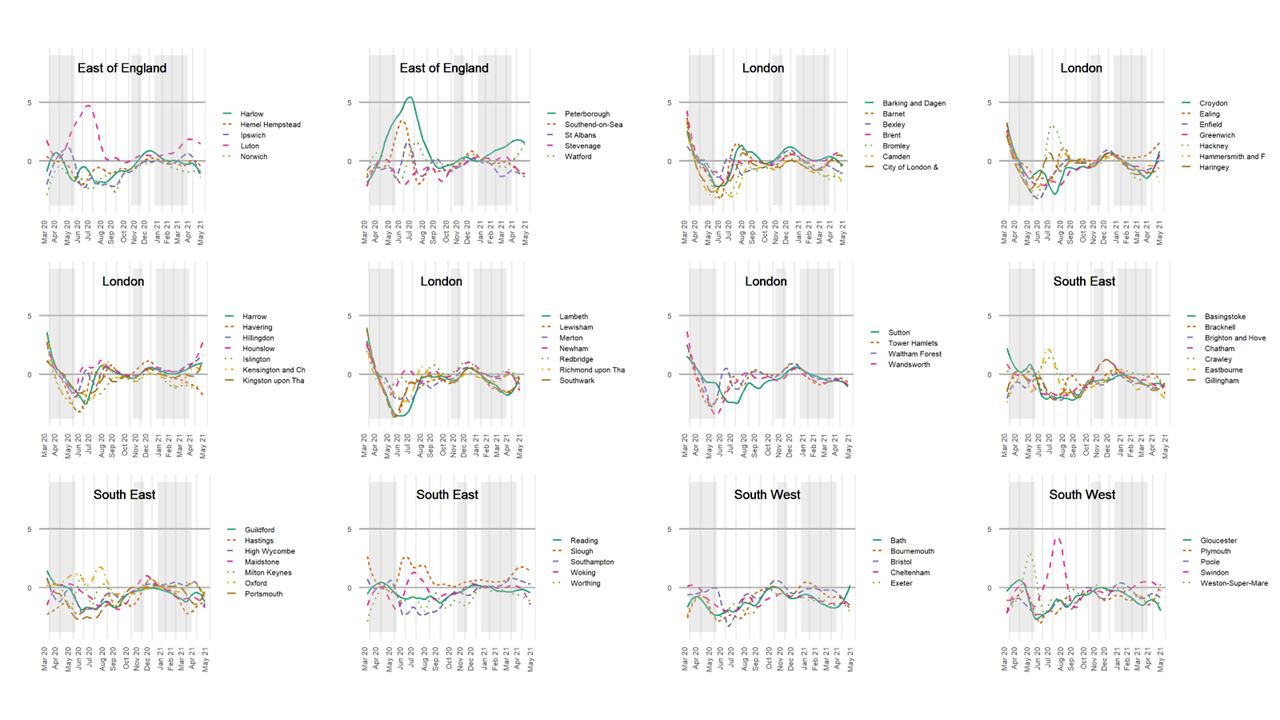
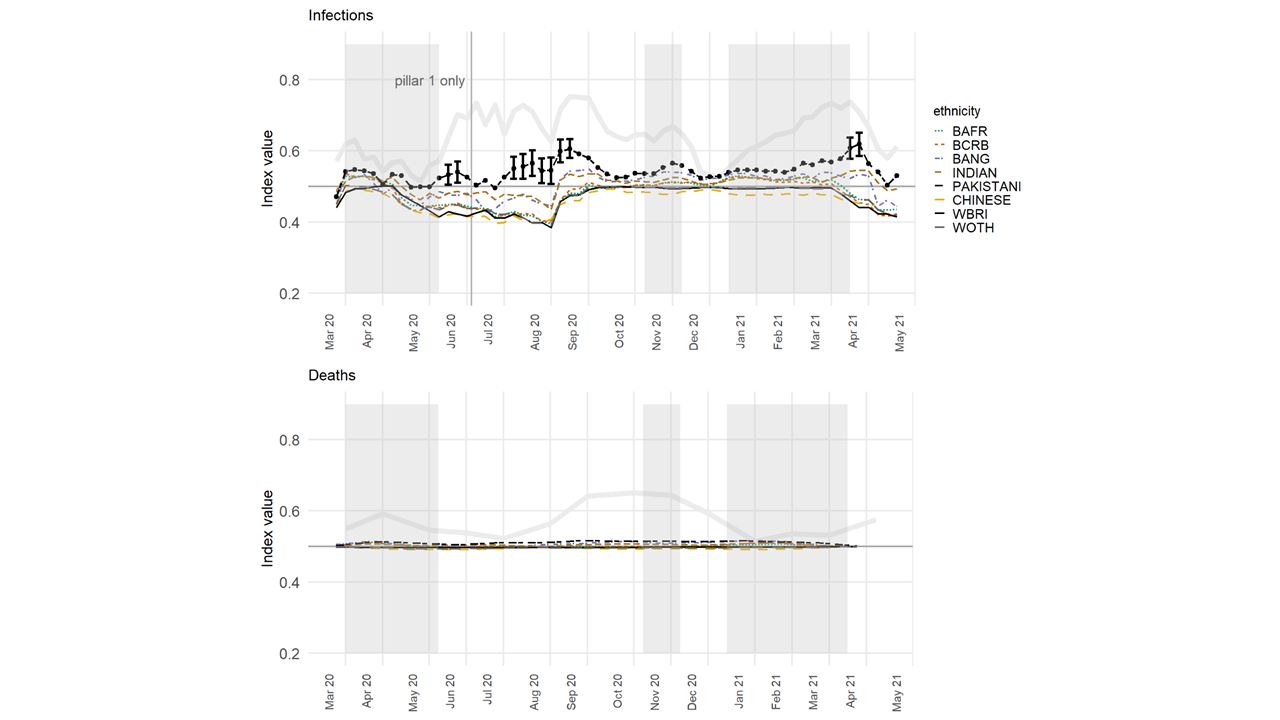
To determine how this affected the economic resilience of different places — their capacity to maintain economic activity — during the pandemic, we analysed data on the upload and download speeds that internet users experienced during the first UK lockdown in 2020.

We found that patterns of demand changed a lot in most of the UK, both in terms of download and upload speeds. People weren’t only using the internet to download data (movies or music, for example) but to upload data, primarily for videoconferencing. Zoom, after all, counted 300 million daily meeting participants worldwide at its April 2020 peak.

Socio-economic correlations

Now, only half of the UK’s workforce were able to continue working remotely. The other half still had to go into work or were furloughed.

To understand whether existing economic divides and digital divides overlapped or diverged, we first created clusters of local authorities based on upload internet speeds as experienced by internet users in these places during the lockdown. We then correlated these clusters with various economic and geographical variables: distances to cities, the north-south economic divide, different occupations, average earnings, number of jobs and businesses, and furlough numbers.

Our findings indicate that areas, including Bristol and Cambridge, with relatively slow and unreliable internet services were not those with the highest percentages of people on furlough. Increased demand for digital services such as Zoom and the resulting network congestion occurred in these areas where (and perhaps because) occupations were more economically resilient: they were able to continue operating despite the pandemic.

Conversely, some areas with reliably high broadband speeds, suffered economically as reflected in high furlough numbers. These areas are characterised by a lack of jobs in the kind of occupations (technology and business services) that enable workers to be productive at home.

The temporary shift to flexible working models ushered in by the pandemic appears to be lasting. Some employers want their staff to return to the office, but many more are planning for hybrid or flexible working. A few are considering a permanent shift to remote working.

This means that the demand for fast and reliable upload and download speeds during working hours in residential areas is here to stay. Ofcom’s latest reports already include more data on upload speeds, and internet service providers will no doubt need to focus more on what customers need during working hours. Government ministers, meanwhile, should be thinking not only about 5G and the wider digital infrastructure, but also about the sort of jobs and skills people need in order to make the best use of it.

As our research illustrates, in order for a place to be economically resilient — for the local economy to continue to operate — during a pandemic, government ministers, community leaders and economists alike need to consider not only the digital divides linked to the internet’s physical infrastructure, but also the associated economic and social divides.

Broadband policies, although necessary, cannot boost the economic resilience of places on their own, where the industrial structure does not align with occupations that incorporate the digital skills and capabilities to work from home. This complex web of digital and socio-economic divides needs to be incorporated into our thinking of local economies and government priorities.

Schools, Segregation and a Scholar

By Rich Harris


It is now a little over 18 months since the publication of my most recent, co-authored book, Ethnic Segregation Between Schools: Is It Increasing or Decreasing in England? (Bristol University Press). 

 The book was written in direct response to the 2016 Casey Review and to the notion, sometimes found in Government-backed policy documents and reinforced by the media, that ethnic segregation is growing in England. It isn’t. Whilst high levels of ethnic segregation do exist between the majority White British and some other groups such as the Bangladeshi and Pakistani – more so at the primary than secondary level of schooling and increased also for the more affluent of the White British – the general trend is towards desegregation and greater ethnic diversity within local authorities and their schools. Key findings of the book include: 

  • The decrease in the percentage of schools in which the White British predominate, albeit that the White British remain the majority or the largest group (but less so than in the past). 
  • Places where the White British are least prevalent (accounting for fewer than ten per cent of pupils in more than half of the schools) are all in London – Newham, Brent, Tower Hamlets, Harrow, Haringey, Lambeth, Redbridge and Ealing – though such schools are also reasonably common in Slough, Birmingham, Leicester, Luton, Bradford, Blackburn, Manchester and Oldham (as well as other parts of London). 
  • Although members of minority groups are, on average, in schools where minority groups form a majority, the White British remains as the group that members of minority groups are most likely to encounter in their schools. 
  • With regard to primary schools, the Bangladeshi and Pakistani are the two groups more likely to be in schools where the White British form a very low percentage of pupils. 
  • The White British are overwhelmingly in primary schools where theirs is the largest group and typically also the majority. It is very rare for a White British pupil to be in a school where the percentage of White British pupils is very low. 
  • Around half or more of pupils in most ethnic groups are in secondary schools where the White British are the largest group. The Bangladeshi and Pakistani groups are an exception to this (and, very marginally so, Black Caribbeans). 
  • It is not typical for a pupil to be in a school where their own ethnic group is the largest group, except for the White British, and for Pakistanis in primary schools. 
  • Although schools with very high percentages of any one minority group do exist, they are extremely rare, becoming rarer. 
  • On average, secondary schools are more diverse than primary schools but both are diversifying.  

 Sadly, the publication was the last that I wrote with my co-author, Ron Johnston. Ron was an exceptional scholar, a giant of the discipline and foundational to the longevity and growth of the Quantitative Spatial Science Research Group (previously Spatial Modelling Group) at Bristol. Working with him wasn’t always easy – his standards were (rightly) high and demanding, and I sensed a frustration that his health at the time wasn’t allowing him to participate as fully to the project as I suspect he would have liked – but his influence on shaping the book was high. His influence on shaping me as an academic, over a longer period of time, was even greater and hugely appreciated as he was always generous with him time, expertise and wisdom. 

As we approach the release of the 2021 Census data there will be opportunity again to revisit the topic of segregation, and where and if it is happening. My prediction? That the trend towards desegregation and greater population mixing will have continued, hampered only not by ethnic segregation but between social segregation and the inequalities between the rich and poor, shaping who can afford to live where. In other words, ethnic segregation will have lessened but will persist until underlying causes, such as inequalities in the labour markets, are more fully tackled. 


Ron Johnston’s obituary in The Guardian can be viewed here. 

The social geography of COVID and who it af-/infects

By Rich Harris

It will be unsurprising to anyone who has followed the COVID-19 pandemic in England that there is geography to the disease, for a while reflected in the ‘tier system’ and in certain towns and cities entering in and out of local lockdowns. Relative peaks and troughs are indicated in the charts, below, which cover the period from the seven days ending March 21, 2020, to the seven ending ending 15 May 2021. 

Figure 1. Indicating the peaks and troughs in exposure to COVID-infected neighbourhoods in English towns and cities (source: Harris & Brunsdon, 2021).

This geography of COVID-19 is both a cause and a consequence of other geographies – including those that are socio-economic, demographic and ethno-cultural. Take, for example, the higher infection and death rates amongst people of colour and, especially, black groups at the outset of the pandemic. This, in part, reflects higher occupational and environmental risks amongst those groups, of the sort that led Channel 4 to be asking ‘Is Covid racist?’. However, it also reflects the ethnic diversity of London, which is a densely occupied and globally connected city where the virus emerged most clearly, soonest, within the UK. It is, in part ‘a London effect’ but not fully, because even within London, a greater number of deaths was associated with Asian and Black ethnic groups, socio-economic disadvantage, very large households (likely indicative of residential overcrowding), and fewer from younger age groups – see Harris, 2020. 

So, what happens if we ‘control’ for the geography and measure the contextual risk of various groups to infection and to death, relative to the town and city in which they reside? The answer is suggested in Figures 2 and 3, which show a measure of average exposure per group, before and after controlling for the geographical trends. 

Figure 2. Index of exposure to COVID in English towns and cities, before controlling for the broad-scale geographical trends (source: Harris & Brunsdon, 2021).
Figure 3. Index of exposure to COVID in English towns and cities, after controlling for the broad-scale geographical trends (source: Harris & Brunsdon, 2021).

Unsurprisingly, taking away the geographical component ‘flattens the curve’, especially for exposure to death in neighbourhoods; although, for infections, differences between the ethnic groups remain clear. This finding should not be understated because even under a restricted scenario that focuses only on urban areas, which removes the broader-scale patterns in the disease and allows for uncertainty in the index scores, still the Pakistani group is found to have been exposed disproportionately to the higher COVID-infected neighbourhoods than are other groups. Meanwhile, the Chinese and the White British are often the least exposed groups, at the local level. 

A partial explanation for the health inequalities is housing inequalities. These, as well as occupational exposure, are linked to other sub-national, socio-economic inequalities including the imbalanced nature of regional economies and employment structures in the UK. 

Writing in The Guardian, Danny Dorling picks up these themes, arguing that the key to understanding the geography of COVID-19, “is the underlying social and economic geography of England. To understand the changing medical geography of this pandemic, you must first understand how the country lives and works.” 

And to tackle the health inequalities that the pandemic has made obvious, you must also tackle residential and employment inequalities too. 


Further reading: 

Harris, R., Brunsdon, C. Measuring the exposure of Black, Asian and other ethnic groups to COVID-infected neighbourhoods in English towns and cities. Appl. Spatial Analysis (2021). https://doi.org/10.1007/s12061-021-09400-8  


Measuring urban living standards and economic activity with energy data

By Sean Fox, Felix Agyemang & Rashid Memon

Spatial comparison of median electricity consumption and radiance in Karachi

As part of our ESRC-funded project Quantifying Cities for Sustainable Development, we’ve been working on creative solutions to a widespread problem: the lack of basic demographic and socioeconomic data in cities in low- and middle-income countries. This data deficit impedes evidence-based planning and policy. How can we get a handle on living conditions and economic activity in cities without traditional administrative and survey data?  

In this project we explore the possibility of using energy data as a proxy for various socioeconomic variables at relatively high spatial resolution. To do this we examine the potential of georeferenced residential electricity meter data and night-time lights (NTL) data in the megacity of Karachi, Pakistan.  

First, we use nationally representative survey data to establish a strong association between electricity consumption and household living standards. Second, we compare gridded radiance values from NTL data with a unique dataset containing georeferenced median monthly electricity consumption values for over 2 million individual households in the city. As the figure shows, these maps are similar, but diverge in important ways. Finally, we develop a model to explain intra-urban variation in radiance values using proxy measures of economic activity from Open Street Map. Overall, we find that NTL data are a poor proxy for living standards but do capture spatial variation in population density and economic activity. By contrast, electricity data are an excellent proxy for living standards and could be used more widely to inform policy and support poverty research in cities in low- and middle-income countries.